Recommended video series

Arbeitsgruppe Visualisierung OvGU Magdeburg
The data generated during the simulation, measurement and modeling of processes have different and sometimes complex characteristics. This lecture provides the basic knowledge on how to prepare, visualize and analyze these data. The acquired knowledge should lead to a better understanding of the underlying data and should include important algorithms and data structures for their representation. The focus is on methods of 3D visualization, which are implemented in the exercises with the help of the established libraries. Duration: 17 episodes..

Arbeitsgruppe Visualisierung OvGU Magdeburg
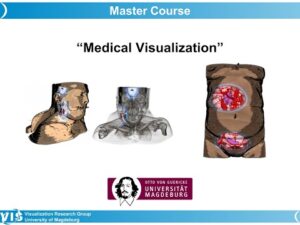
In this video lecture, we introduce the topic medical visualization, answering questions, such as: What is special about medical visualization?, Which data is often employed?, What are typical requirements?, Which target user groups are addressed?
This is an application-oriented lecture. Thus, we do not only discuss what is technically feasible, but we constantly consider benefits for diagnosis, treatment planning, medical education or rehabilitation. 3D Medical visualization often supports communication, e.g., in a tumor board or a stroke unit. Visualization is based on medical image data but may also involve simulation results, e.g. the dose distribution in radiation treatment planning.
We show a couple of examples, including pioneering work from the VoxelMan group who employed the Visible Human dataset for 3D anatomy and surgery education. We also briefly introduce MeVisLab, the library that is used in the exercises and VMTK, the vascular modeling toolkit. Duration: 16 episodes..
